
Digital Endemic Businesses: 2022 2nd Quarter Takeaways
- POV’s
- August 25, 2022
- Kate Scott-Dawkins
Digital Endemics, defined as companies with businesses that are centered online, are an increasingly important source of advertising revenue, especially on digital channels. These digital-savvy companies are more likely than large incumbent brands to buy media in-house, and as a result their impact on the total advertising industry is often poorly understood, tracked, or appreciated by advertisers, agencies and industry associations alike. We have compiled a composite of 40 digital endemic companies using public financial documents in order to provide a more comprehensive look at the drivers of global advertising.
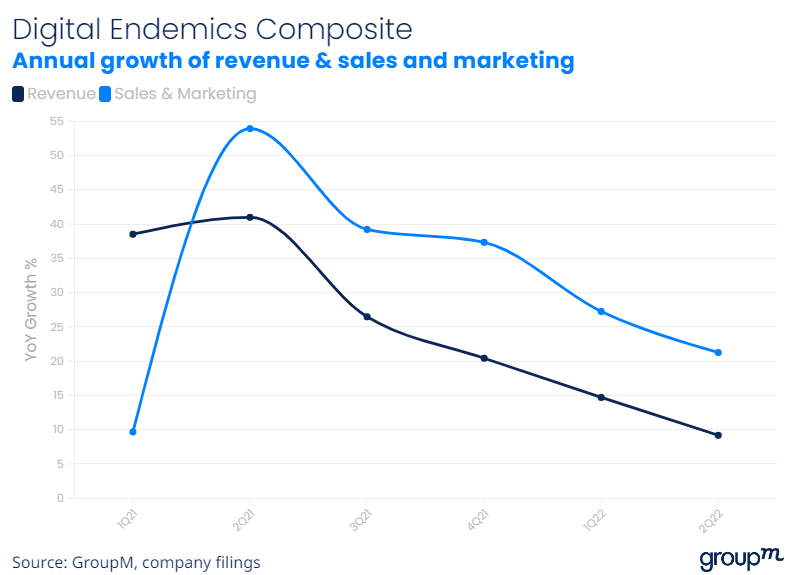
Looking at the full composite, which includes large companies like Google and Amazon as well as smaller companies like Poshmark and Squarespace, we can see that year-over-year (YoY) revenue growth has slowed appreciably over the last 15 months. Revenue for all companies totalled $251 billion in Q2 of 2021, up 41% over the same period in 2020. The digital endemics followed that up with three more quarters of double-digit, albeit decelerating, growth. That brings us to the second quarter of this year, with its high inflation and recessionary fears and one can see a different picture: revenue for the full composite grew to $274 billion, or just 9% over 2Q of 2021 (admittedly a tough comparable for this set).
At an aggregated level, this data suggests the following:
- Many of these companies benefited from the changes brought on by the global pandemic. Food delivery companies kept people fed, gaming companies kept them entertained, and e-commerce companies equipped their home gyms, schools and offices.
- A return to pre-pandemic routines, a surfeit of stimulus-fueled electronics and home goods purchases, and a pent-up wanderlust have reversed trends seen in late 2020 and early 2021 regarding consumer expenditures.
- The sales and marketing expenses for these companies (a figure that generally tracks closely to advertising expense and is available on a quarterly basis rather than an annual one) help explain the extraordinary growth in advertising revenue for 2021 (+22%). Growth of sales and marketing costs consistently exceeded revenue growth for this period. Note: sales and marketing costs include salaries among other expenses.
- Sales and marketing growth for the full composite peaked at 54% YoY in 2Q21. S&M growth remains at 21% for the second quarter of this year when looking at absolute values across the group (skewed by larger members like Amazon), but the median growth for sales and marketing in 2Q22 was just 3.1%, and may help explain some of the ad seller narratives around a “pullback” of spending.
- This group of companies is key to the advertising industry because they tend to be quite high intensity advertisers, that is the median company in this group spent between 23% and 29% of revenue on sales and marketing in each of the 10 quarters between the January of 2020 and June of 2022.
Our conclusions are reinforced by looking at various cuts of the data to isolate large companies, travel companies or e-commerce companies.
- If we remove Google and Amazon, we see an even steeper deceleration in revenue growth between 1Q22 and 2Q22, driven by declines in cryptocurrency and e-commerce revenue.
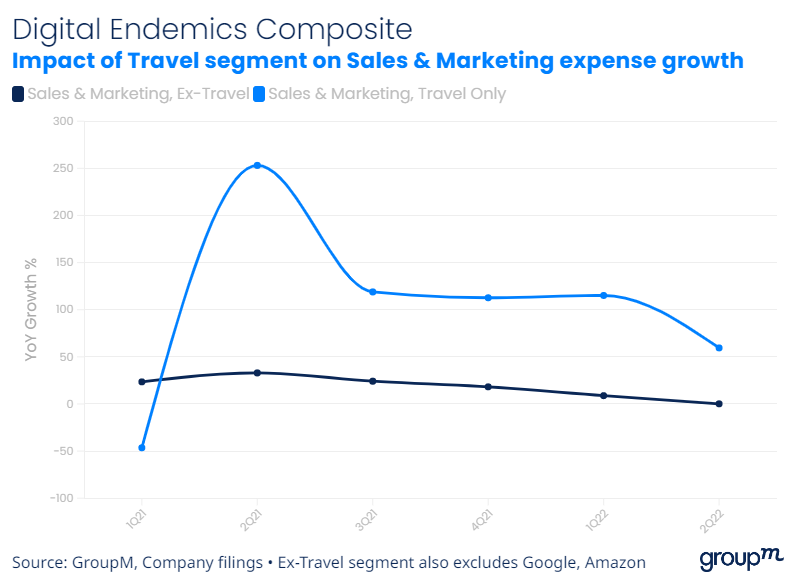
- If we look at travel separately, we can see a divergent dip in sales and marketing expense during the earlier stages of the pandemic, and faster growth into the latter stages.
- This group of travel companies accounted for $11 billion of sales and marketing spending in 2021, and has already reported nearly $8 billion through the first half of 2022. Removing them from the sales and marketing growth calculation reduces 2Q22 growth to 0%.
Digital endemics may be disproportionately responsible for industry growth and as they decline, it can drive negative trends.
Sales and Marketing Expense Growth by Sub-segment
Looking at our sub-composites, only Travel grew at a pace above the global inflation figure of 7.4% with Retail notching a decrease in spending of -19% year-over-year.
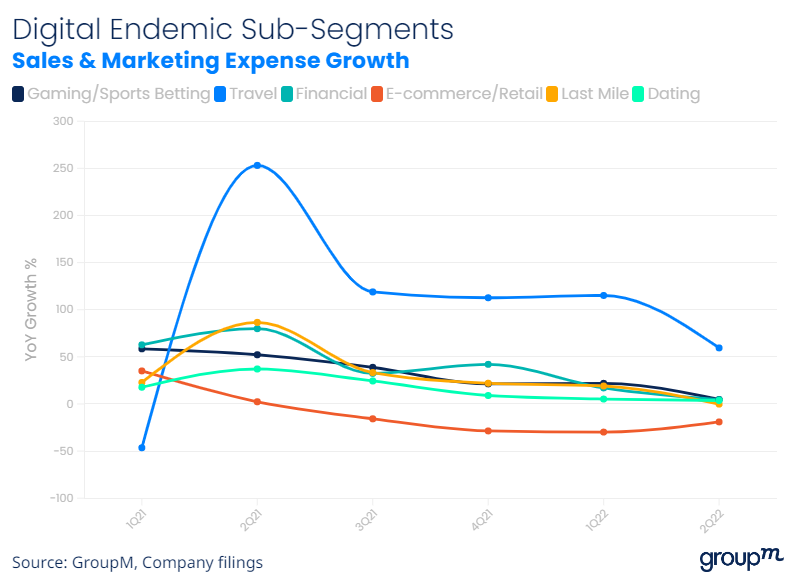
- Gaming reported sales and marketing growth of 5% for the quarter, however revenue declined 8% from Q2 2021. Segment total sales and marketing expense of $945 million in Q2
- Travel revenue grew 71% from Q2 2021, while sales and marketing expense increased roughly in line at 59%. Segment total sales and marketing expense of $4.5 billion in Q2
- Financial grew total sales and marketing expense by 5% over Q2 2021. Segment total sales and marketing expense of $1.5 billion in Q2
- Last Mile sales and marketing expense was down 0.2% for the quarter, despite revenue growth of 80% over Q2 2021. Segment total sales and marketing expense of $1.8 billion in Q2
- E-commerce/Retail declined 19% from Q2 2021 in line with revenue decline of 20%. The retail sub-segment does not include Amazon due to its ability to skew the data. Amazon’s sales and marketing expenses grew 34% over Q2 of last year. Segment total sales and marketing expense of $1.4 billion in Q2 (excluding Amazon)
- Dating grew sales and marketing spend by 4% for the quarter. Segment total S&M expense of $185 million in Q2